Skip to content
NYCHOLAS BURNS
HomeJournalAboutThe Foundry
FAITH & FRONTIERS
← The Foundry

FIELD NOTES No. 002 / THE ART OF FINDING OURSELVES

How did we
know where
we were?

An ocean. A sky. And the centuries of ingenuity it took to turn them into a place on Earth.

By Nycholas Burns History & human ingenuity · 24 min read
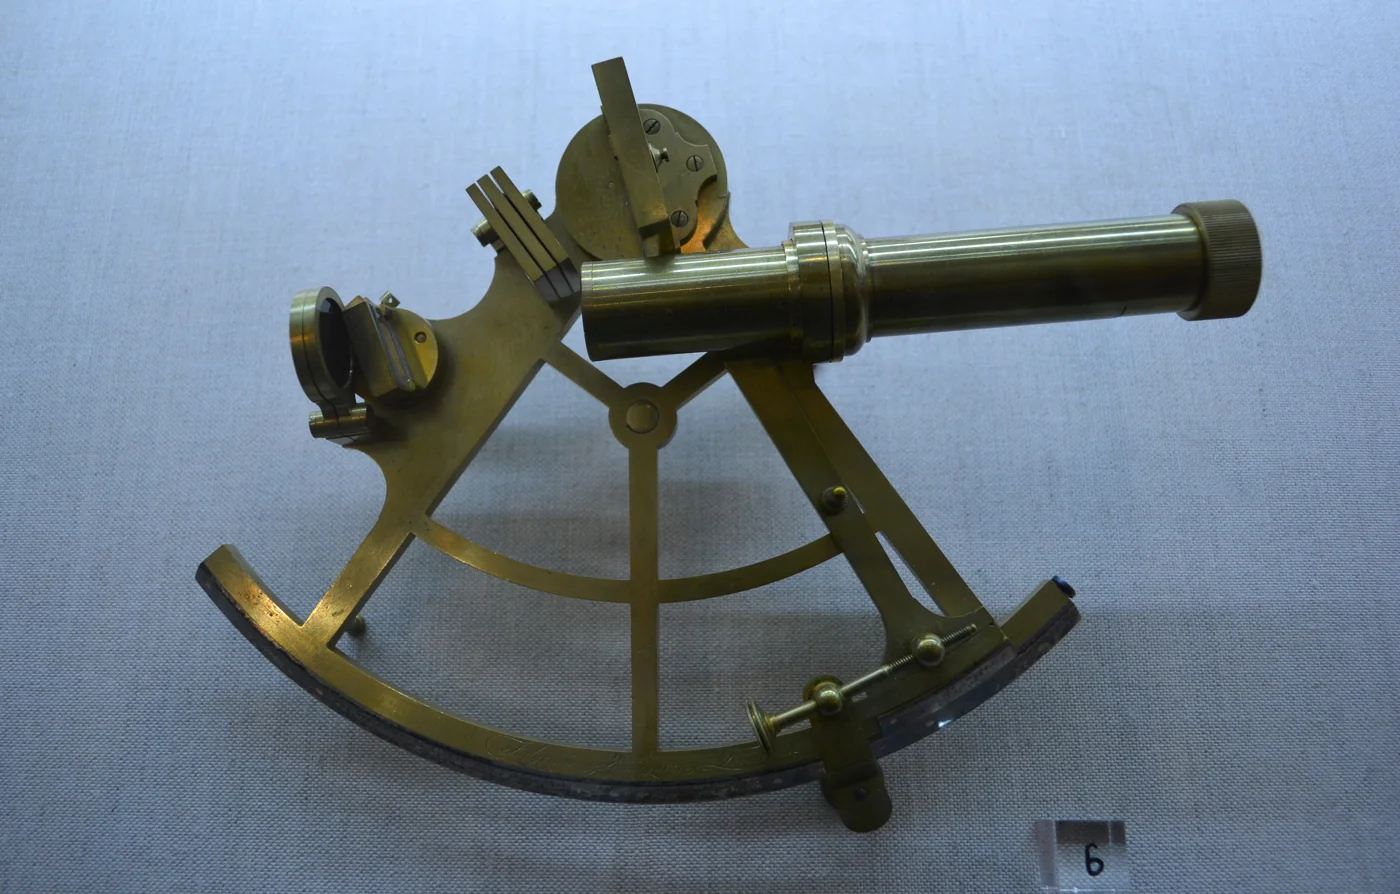
An authentic brass sextant made in 1805, showing its telescope, mirrors, pivoting arm and curved measuring scale.
The sextant, up close.Sextant by Fulgencio Rodríguez, 1805. Museo Naval de Madrid.Photo: Jerónimo Roure Pérez (Dorieo), Wikimedia Commons · CC BY-SA 4.0. Resized and compressed.
OCEAN / SKY / TIME / PAPERBegin the passage ↓
01 The estimate02 The angle03 The time04 The clock05 The system06 On land07 The blue dot

Imagine waking up aboard a wooden ship after several days at sea. You climb onto the deck and look around. Water in every direction. The captain says you are making good progress. But toward what, exactly—and how does anyone know?

I started wondering about this because the modern version feels so effortless. I open a map on my phone, and a blue dot tells me where I am. Take away the satellites, the radio and the electronics, and I can picture a sailor holding a compass. I just could not picture how that compass became a mark on a map.

The answer turned out to be a series of smaller answers. First, keep track of where you think the ship has gone. Then find something that can check your estimate. Each solution makes another problem visible, until a rope, a star and a remarkably good clock begin to belong to the same story.

01 / START WITH WHAT YOU KNOW

First, keep track of
the journey.

Let’s give our ship a starting point: a harbor whose position is already known. While the coast is visible, the crew can recognize hills and headlands. A compass tells them the direction of those landmarks, and a nautical chart—a map made for navigating water—helps them work out where the ship is.

Then the land disappears. The compass still shows which way the bow is pointing, but it cannot tell the crew how far they have traveled. For that, they need two more things: speed and time. If you know your starting point, direction and distance, you can draw a line to the place you expect to be.

Sailors call this dead reckoning: carrying your last position forward using your best account of the journey. It is the same reasoning you might use on a long, straight road. An hour at a steady speed puts you a certain distance beyond the place you left. [1]

But how do you measure speed on water?

There is no roadside marker slipping past the ship. The crew has to put something in the water and watch the ship move away from it. One ingenious tool for this was the chip log.

The “chip” was a piece of wood shaped rather like a slice of pie. Weight along its curved edge helped it float upright. A sailor dropped it from the back of the ship, with a light rope attached. The wood resisted being pulled through the water while the moving ship drew rope off a reel.

Knots marked evenly spaced intervals along the rope. Once the chip had cleared the churned-up water behind the ship, one sailor turned a small sandglass while another counted the intervals running out. More rope in the same amount of time meant a faster ship. [3]

FIG. 01 / MEASURING SPEEDChip log & sandglass
A wooden chip resists the water behind a ship. Knotted intervals on the line pay out from the stern while a sandglass times the measurement.
01 Weighted chip02 Marked line03 Timed glass
One documented later pairing: intervals of 47 feet 3 inches, timed over 28 seconds. Six intervals in that period meant about six knots.

The spacing of the knots and the length of time had to match. In one later arrangement, knots about 47 feet 3 inches apart were counted over 28 seconds. Six intervals passing out meant about six knots. That word is still our unit for a ship’s speed: one knot is one nautical mile per hour. A nautical mile is a little longer than a land mile—exactly 1,852 meters today. [3]

The equipment changed over time. Earlier combinations included roughly 42-foot intervals and a 30-second glass. There was no single rope-and-glass standard shared by every ship in every century; what mattered was matching the knot spacing to the time measured by the glass. [2]

A sensible estimate can still be wrong.

Now our navigator has enough information to draw a course. Suppose the ship travels east at six knots for four hours. Six nautical miles each hour, for four hours, gives 24 nautical miles. The navigator marks a point that far east of the previous position.

FIG. 02 / DEAD RECKONINGA course is an estimate.
A starting position leads 24 nautical miles east to an estimated position. A second track ends farther north, illustrating displacement by a current.
A Known positionB Estimated: 24 nautical miles eastC Actual, with current
Illustrative conditions: six knots east for four hours. A one-knot northward current would add four nautical miles north. The distances use the same scale in both directions.

But imagine a current also carrying the ship north. The crew might never notice: the ship and the floating chip are both riding in that moving water. The rope measures the ship’s speed through the water, not its speed over the seabed. Wind can push it sideways too, a drift sailors call leeway.

By evening, the mark on the chart and the ship’s actual position may have parted company. Tomorrow’s estimate starts from today’s uncertain mark, so the error can grow. Dead reckoning is useful, but it leaves our navigator wanting a second opinion. With no land in sight, the obvious place to look is up.

02 / THE SKY GIVES YOU AN ANGLE

The North Star answers
half the question.

Before following the sailor’s gaze, picture the lines on a globe. The equator circles Earth halfway between the poles. Latitude tells you how far north or south of that line you are. The equator is 0 degrees; the North Pole is 90 degrees north. A place at 40 degrees north is partway between them.

Those numbers describe an angle, which is just a way of measuring a turn. Looking straight ahead and then straight up is a quarter-turn: 90 degrees. Looking halfway between those directions is 45 degrees. This is the kind of angle a navigator can measure in the sky.

In the Northern Hemisphere, there is a particularly useful star: Polaris, the North Star. As Earth turns, most stars appear to sweep across the sky. Polaris seems to stay almost in one place, close to the point directly above Earth’s North Pole. [4]

Here is the surprising part: the farther north you travel, the higher Polaris appears. Near the equator, it is down near the northern horizon—the line where sea and sky seem to meet. At the North Pole, it is almost directly overhead. Between those places, its height above the horizon gives you approximately your latitude.

FIG. 03 / LATITUDELook north. Measure up.
A complete observer symbol looks north toward Polaris, shown as a star. A 40-degree arc connects the level horizon to the sight line, illustrating approximately 40 degrees north latitude.
40° above the horizon ≈ 40° north
The angle is measured upward from a level horizon. Polaris is shown as a star symbol; it is extremely far away. Its height gives approximate latitude, with small corrections for a precise observation.

So if our navigator measures Polaris about 40 degrees above the northern horizon, the ship is near 40 degrees north. That is a piece of information the current cannot quietly erase. Even if the estimated course was wrong, the sky offers a fresh check.

Why does that work?

Imagine an arrow running through Earth from the South Pole to the North Pole and continuing into the sky. It points almost toward Polaris. Now imagine walking north around the curved Earth. The star stays in nearly the same distant direction, but the patch of Earth beneath your feet curves away. Your local horizon tilts with it. The angle between that horizon and the star grows by about the same amount as your latitude.

Polaris is close to the end of that imaginary arrow, not exactly on it. The exact point is called the north celestial pole—simply the North Pole’s direction projected onto the sky. Navigators used tables to allow for the star’s small offset. South of the equator, Polaris drops below the horizon and this particular shortcut stops being useful. [5]

I

THE SEXTANT / MEASURES AN ANGLE

Put a number on what you see.

That leaves a practical question: how do you measure the gap between a star and the horizon while standing on a moving deck? A sextant gives the navigator a way to bring both into the same view.

Look through its small telescope and you can see the horizon directly. Mirrors bring a second image, of the star or Sun, into that view. Moving the instrument’s arm tilts one mirror and moves the reflected image. The navigator adjusts it until the star appears to sit on the horizon. For the Sun, dark filters protect the eye, and its lower edge is brought down to touch the horizon.

The scale on the curved edge then shows the angle that separated them. The instrument’s name comes from that arc: about one-sixth of a circle, or 60 degrees. Because the light reflects twice, the sextant can measure angles roughly twice as large. An earlier instrument, the octant, worked on the same principle with a smaller arc. [7]

The reading still needs a few adjustments. Air bends the light slightly, an observer high above the water sees a lower sea horizon, and the instrument itself may read a little high or low. These are corrections to a measurement, much like allowing for a ruler whose zero mark is worn. The central idea remains simple: measure how high the star appears, then use that angle to estimate how far north you are.

And when the stars are gone?

In daylight, the navigator could use the Sun. Around local noon, it is near its highest point for the day. “Local noon” here means noon by the Sun at the ship’s location, not noon in a modern time zone.

The Sun introduces one extra complication: its position shifts with the seasons. A book of astronomical predictions tells the navigator how far north or south of the equator the Sun appears in the sky that day. That seasonal position is called its declination. It lets the navigator account for the date before turning the measured angle into latitude. [6]

For a simple example, imagine one of the two yearly equinoxes, when the Sun is approximately over the equator. If the noon Sun stands 50 degrees above the southern horizon, you are about 40 degrees north: 90 minus 50. At other times of year, the book supplies the seasonal adjustment.

We have answered half of the ship’s question. We can find its north–south position. But 40 degrees north is a whole circle around Earth, crossing oceans and continents. Where along that circle are we?

03 / THE EARTH IS ALSO A CLOCK

East and west
are a matter of time.

Longitude tells you how far east or west you are. The lines for it run from pole to pole, like the seams of an orange. Each line is called a meridian. Unlike the equator, no meridian is an obvious starting line. People had to agree on one; today we use the line through Greenwich, in London.

Our North Star measurement cannot tell these meridians apart. Travel east or west while staying at the same latitude, and Polaris remains about the same height. We need another clue.

The clue is that Earth turns. Imagine two towns, one east of the other. The eastern town faces the Sun first, so its noon arrives first. The western town gets its turn later. The same thing happens between Greenwich and a ship: the difference in their local times reveals the distance between their meridians.

The arithmetic is wonderfully small. A full turn is 360 degrees. The daily cycle from one noon to the next takes about 24 hours. Divide 360 by 24 and you get 15 degrees per hour. An hour’s difference in solar time corresponds to 15 degrees of longitude. [8]

Keep one clock on Greenwich time.

Suppose we could bring along a clock that kept the time at Greenwich. We would leave it on that reference time throughout the voyage. Meanwhile, observations of the Sun would tell us the local time aboard the ship.

Now imagine the Sun tells us it is local noon, but the Greenwich clock says 3 p.m. Greenwich had its noon three hours ago; ours is only arriving now. We must be west of Greenwich. Three hours multiplied by 15 degrees gives 45 degrees west.

If that clock instead says 9 a.m., our noon has arrived three hours before Greenwich’s. We are on the eastern side: 45 degrees east. Try changing the Greenwich time below and watch the ship’s position change.
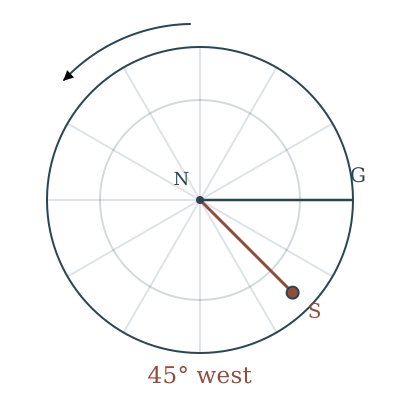
FIG. 04 / LONGITUDETwo places. One moment.
View from above the North Pole. The ship’s meridian is 45 degrees west of Greenwich; Earth rotates eastward.

ABOARD THE SHIP

Local noon 12:00

3 hours × 15° = 45° west

Greenwich reached noon three hours before the ship.

Viewed from above the North Pole (N). G marks Greenwich; S marks the ship. The arrow shows Earth’s eastward rotation. The illustration looks down from above Earth; the ship itself is on the surface. This teaching model compares solar times after any clock-time correction.
ONE SMALL COMPLICATION / THE SUN IS NOT PERFECTLY STEADY

An ordinary clock divides the day into equal hours. The real Sun does not keep that perfectly even schedule throughout the year. Navigators therefore used a correction from tables, called the equation of time, to put Sun time and clock time on the same footing. The example above assumes that adjustment has already been made. Time zones and daylight saving time do not enter this comparison. [9]

This was the missing step I had been looking for. A compass helped keep the ship on course, and an angle in the sky helped find latitude. For longitude, a navigator needed a trustworthy comparison between the time here and the time somewhere else. The idea was simple. Building a clock that could preserve that “somewhere else” across an ocean was another matter.

04 / MAKE TIME SURVIVE THE VOYAGE

The missing instrument
was a dependable clock.

Picture taking a grandfather clock to sea. Its pendulum is meant to swing evenly while the clock stands still. Now the whole room rolls and pitches around it. Even without that motion, heat and cold change the size of metal parts, friction changes their movement, and damp air and lubricants complicate the mechanism. Keeping steady time for weeks becomes a formidable task. [10]

Small errors matter. Four minutes of clock error become one degree of longitude—about 60 nautical miles at the equator. A clock losing only four seconds each day would be four minutes behind after 60 days, unless the navigator knew about that loss and allowed for it. What looks like a tiny problem in a workshop can move a ship’s plotted position a dangerous distance.

Britain had powerful reasons to solve this. Ships carried trade, naval power and people, and uncertain positions could end in wrecks. In 1714, Parliament passed the Longitude Act, offering rewards for a practical solution. The largest reward, £20,000, required accuracy within half a degree under the Act’s trial conditions. A group of commissioners, known as the Board of Longitude, assessed proposals and helped fund promising work. [11]

One of the people who took on the problem was John Harrison, a carpenter and clockmaker. He spent decades asking a deceptively hard question: could a machine keep the same rhythm aboard a ship that it kept at home? His surviving timekeepers show how much the answer changed as he worked.
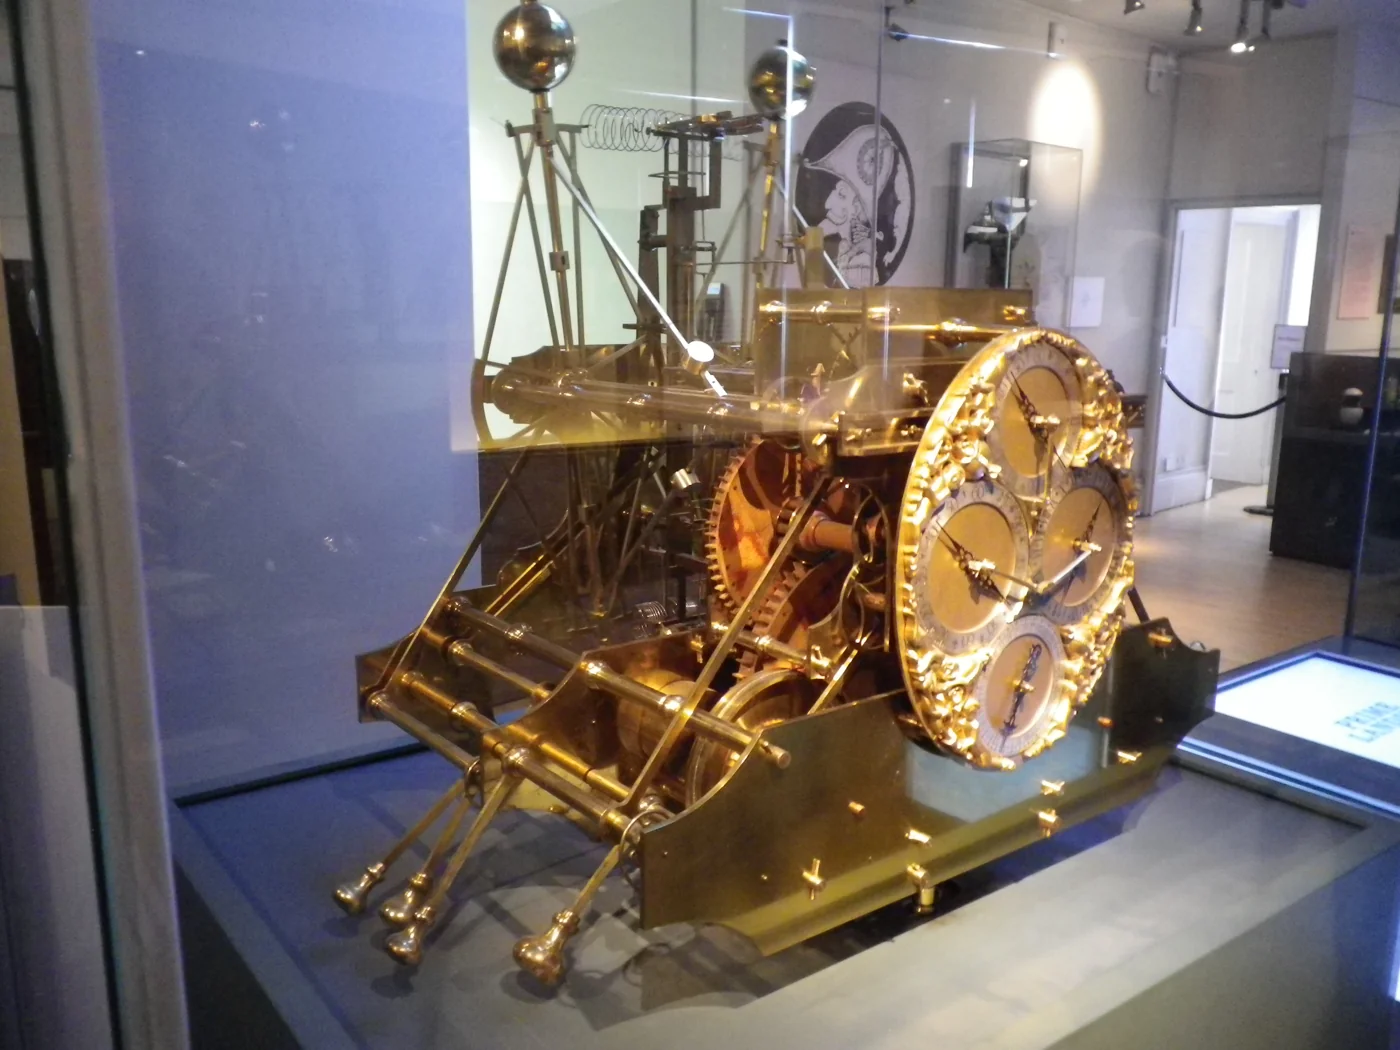
Harrison’s first sea clock at Greenwich. The exposed mechanism makes the scale of the machine tangible.
H1 / 1735Harrison’s first sea clock at Greenwich. The exposed mechanism makes the scale of the machine tangible.Photo: Fernando Losada Rodríguez, Wikimedia Commons · CC BY-SA 4.0. Resized and compressed.
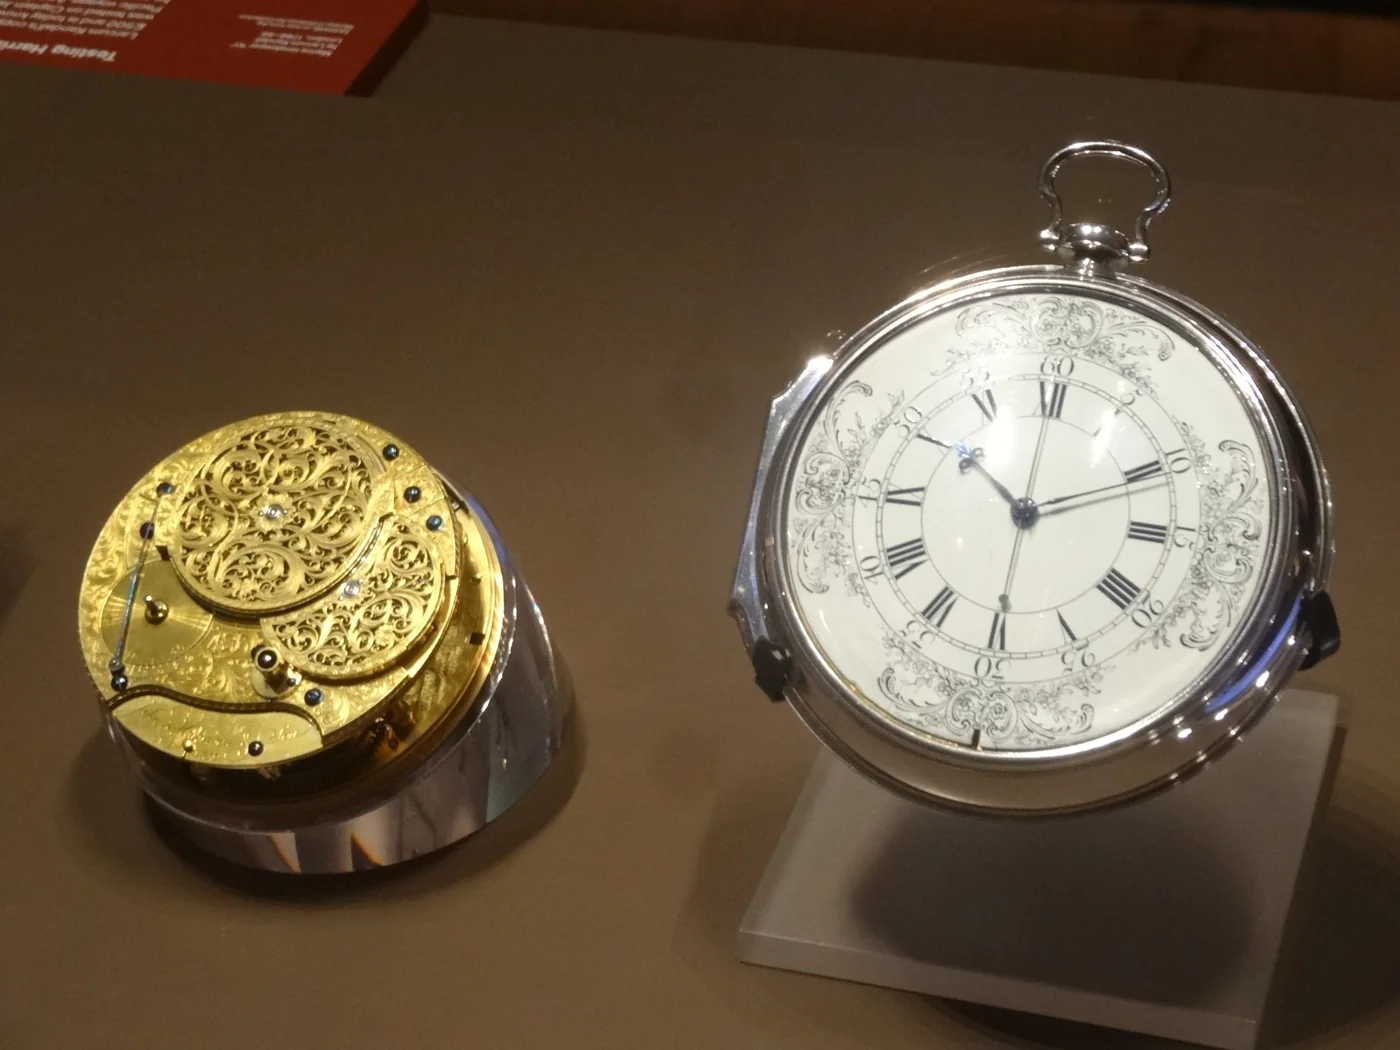
The later sea watch, with its face and decorated mechanism on display. The two photographs are not shown to the same scale.
H4 / 1759The later sea watch, with its face and decorated mechanism on display. The two photographs are not shown to the same scale.Photo: Jordiferrer, Wikimedia Commons · CC BY-SA 4.0. Resized and compressed.

JOHN HARRISON / FROM SEA CLOCK TO SEA WATCH

  1. H1 1735

    Harrison’s first large experimental sea clock went on a trial voyage to Lisbon in 1736. It showed that a timekeeper could provide a useful check on the ship’s estimated position.

  2. H2 1739

    He built a revised machine, then identified a flaw in its design. It never went to sea for a trial. He started again.

  3. H3 1740–1759

    The next attempt occupied nineteen years. Harrison learned a great deal, but the clock still did not reach the standard he wanted.

  4. H4 1759

    The breakthrough looked different: a large watch. Trials on voyages to Jamaica in 1761–62 and Barbados in 1764 demonstrated the required accuracy.

There was no tidy ending in which Harrison returned and collected a single prize. Tests, disclosure of his designs and the question of whether others could reproduce the result led to years of dispute. He received money in stages, including a later award from Parliament. [12]

What stays with me is the time hidden inside those four labels. H3 alone took nineteen years. The task was not just to make something that worked once. It was to make something a navigator could keep trusting after weeks of motion, weather and wear.

A clock whose habits you could trust.

Later makers developed increasingly practical marine chronometers—precision timekeepers made for sea navigation. Many were kept in wooden boxes, supported on pivoting rings that helped them stay level. Their purpose was the same as Harrison’s: carry dependable reference time into an unpredictable environment.

A chronometer did not have to be absolutely perfect. If it reliably gained two seconds each day, the navigator could subtract the accumulated gain. That daily gain or loss is called its rate. A clock with a known, steady habit was much more useful than one whose behavior changed without warning. [13]

Now we have a sky measurement and a clock reading. But neither comes with a map pin attached. Someone still has to turn those numbers into a position. For that, our navigator reaches for a book.

05 / PUT THE ANSWERS TOGETHER

A position takes
more than an instrument.

A sextant measures an angle. To make that angle useful, the navigator needs to know what the Sun, Moon or star should be doing at the time of the observation. This is where an almanac comes in: a book of predicted astronomical positions, arranged by date and time.

The first British Nautical Almanac was published in 1766 for use in 1767, under the direction of Astronomer Royal Nevil Maskelyne. Its tables brought the work of astronomers and people doing calculations ashore onto the navigator’s desk. The Sun’s seasonal adjustment from our latitude example was part of the kind of information a navigator could look up. [14]

There was even a way to get reference time from the sky. The Moon moves across the background of stars. Measure its angle from a suitable star or the Sun, make the necessary corrections, and compare the result with predicted angles in the tables. The matching prediction tells you the reference time. These observations were called lunar distances: “distance” meant a gap measured as an angle in the sky. [15]

It was demanding work, but it offered an alternative while chronometers were expensive. The clock and the lunar method were two ways of answering the same question: what time is it at the reference meridian? Greenwich grew in importance through its astronomical work and the use of its meridian in tables and charts. International agreement on Greenwich as the prime meridian came in 1884, long after Harrison’s work. [16]

Finally, the numbers go onto the chart.

Think of a nautical chart as the navigator’s workbench. Its coastlines show where land lies. Numbers mark measured depths; other markings identify shallow water, hazards and useful landmarks. Latitude and longitude scales let the navigator place the ship among those features, then decide where to go next. [17]

FIG. 05 / THE CHARTWhere the observations meet.
An original illustrative nautical chart with a coastline, depth soundings, a compass rose and a plotted course from a marked position.
The cross marks a plotted position; the dashed course runs toward open water. Numbers represent illustrative depths in fathoms (one fathom is six feet). This is an invented teaching chart, not a real coast.

Dividers—the hinged tool with two pointed legs—help lift a distance from the chart and compare it with a scale. Parallel rules let the navigator slide a direction across the paper without changing its angle. On the common Mercator type of chart, north–south and east–west lines form a rectangular grid, but the distance scale changes with latitude. The navigator measures distance against the latitude scale near the planned course. [19]

The compass needs judgment too. Its needle points toward magnetic north, which is not exactly the direction of the geographic North Pole. The difference varies by location; metal and magnetism aboard the ship can affect the reading as well. Navigators allow for those differences before treating a compass direction as a direction on the chart. [18]

Near land, there is another way to check the story. Lower a lead weight on a marked rope and you can measure the depth. A patch of tallow—animal fat—in a hollow beneath the weight can bring up grains of sand or mud. Compare the depth and bottom material with the chart, and the seabed itself becomes a clue. This tool is the lead line. [6]

ONE POSITION, MANY PIECES OF EVIDENCE

  1. Keep an estimate

    The compass gives direction. The chip log and sandglass give speed. Speed and elapsed time give distance from the last known position.

  2. Take a fresh measurement

    The sextant measures an angle in the sky. The chronometer supplies reference time when the method requires it.

  3. Make sense of the numbers

    The almanac supplies the sky’s predicted positions. Tables and calculations connect the observation to a place on Earth.

  4. Compare and choose

    Plot the result on the chart. Compare it with the estimate and other clues. Decide which course to steer next.

That is the system I could not picture at the beginning. No single object did the whole job, and not every ship in every period carried all these tools. Each observation narrowed the uncertainty. In later celestial methods, one timed sight often placed a ship somewhere along a line of possible positions. A second suitable sight could provide another line; where the lines crossed was a possible fix, or measured position. [5]

Clouds could hide the stars. A rough sea could make the horizon hard to judge. Two instruments might disagree. The navigator’s work was to keep comparing the evidence, know when an answer was uncertain, and carry the best estimate forward until a better check became possible.

06 / THE SAME QUESTION ON LAND

The problem followed
explorers inland.

My curiosity eventually followed this problem off the ship and into the journey of Lewis and Clark. During their 1804–1806 expedition, they also had to turn a route traveled into a position recorded. Rivers and hills replaced open ocean, but a compass alone still could not tell them where they were.

Their equipment included a sextant, an octant, compasses and a chronometer. Clark kept track of directions and estimated distances, drew the route, and incorporated astronomical observations and geographic information from Indigenous people. They were crossing inhabited country with existing knowledge of its places and routes. [20] [24]

On land, even the horizon could disappear behind trees or hills. An artificial horizon solved that problem: a level reflecting surface showed an image of the Sun. The observer measured between the real Sun and its reflection. Because the reflection lies as far below level as the Sun lies above it, the measured angle is twice the Sun’s height. Divide by two, and the needed angle returns. [21]

Longitude was still difficult. The expedition recorded observations of the Moon, but the pocket chronometer was not consistently dependable, and the measurements and calculations were demanding. Their notebooks do not tell a story of explorers casually reading precise coordinates from a watch. They show people working hard to connect a journey on the ground with a larger map. [22]

07 / WHAT THE BLUE DOT CONTAINS

Now I can see
what the blue dot hides.

Better chronometers made the work more dependable. Radio and electronic navigation offered new ways to compare a ship’s position with known reference points. Eventually satellites made it possible to answer the question almost anywhere, almost instantly.

GPS still depends on time. Satellites broadcast signals that tell a receiver where the satellites are and when the signals were sent. The receiver uses their travel times to work out distances. Normally it needs at least four satellites to solve for its position in three dimensions and correct the error in its own clock. [23]

I think about the blue dot on my phone differently now. It looks like one answer appearing out of nowhere. Underneath it are the same kinds of ingredients our navigator needed: reference points, careful measurements, time, mathematics and a way to put the result on a map.

The wonder, for me, is being able to picture the older version at last. A person stands on a moving deck, measures a star above the horizon, checks a clock, opens a book and makes a mark on paper. Each step is understandable. Together, they connect one small patch of ocean to the whole planet.

I began with a question about what sailors lacked. I came away thinking about what they had learned to notice—and how much patient work it took to turn those observations into a way home.

The grid was invisible.
Learning to read it was human.

THE RECORD BEHIND THE STORY

Sources & further reading

Research checked September 14, 2026. The numbered links connect the explanations above to their sources. Numerical demonstrations are simplified teaching examples, not instructions for navigating a vessel.

  1. NOAA — The early history of chart-makingDead reckoning: advance a prior position using heading and distance.
  2. International Hydrographic Review — The nautical mileAlton B. Moody, 1950; republished 2023. Historical log-line spacing and sandglass calibration.
  3. NOAA — The nautical mile and the knotCommon-log operation, the origin of knots and the modern nautical mile.
  4. Royal Museums Greenwich — Ursa Minor and PolarisPolaris, the north celestial pole and the latitude relationship.
  5. The American Practical Navigator — Sight reductionsBowditch, 2019, chapter 19 (PDF mirror). Corrected altitudes, latitude by Polaris and lines of position.
  6. The Mariners’ Museum / NOAA — Tools of navigationInstrument context, solar altitude, sea timekeeping and the lead line.
  7. Museo Galileo — The sextantThe instrument’s graduated sector, telescope, moving mirror and solar filters.
  8. Royal Museums Greenwich — What is longitude?Comparing local and reference time to find longitude.
  9. U.S. Naval Observatory — The equation of timeWhy apparent solar time and uniform mean solar time differ.
  10. MyLearning — Harrison and the chronometerMotion, temperature, humidity and friction as timekeeping challenges.
  11. Royal Museums Greenwich — Why the search for longitude matteredThe 1714 Act, Commissioners of Longitude, incentives and maritime stakes.
  12. Royal Museums Greenwich — Harrison’s timekeepersH1–H4 development, voyage trials and the dispute over rewards.
  13. Royal Museums Greenwich — Parry’s Arctic experimentsWhy knowing a chronometer’s rate matters more than expecting no error.
  14. U.S. Naval Observatory — History of The Nautical AlmanacPublication in 1766 of the first British volume, with data for 1767.
  15. Royal Museums Greenwich — Maskelyne and the lunar methodLunar distances, predicted tables and the work of human computers.
  16. Royal Museums Greenwich — Greenwich and the prime meridianThe Observatory’s astronomical work and the 1884 meridian agreement.
  17. NOAA — What distinguishes a nautical chart from a map?Navigation information, coastlines, depths and hazards.
  18. U.S. Navy — Quartermaster training manualPrimary naval training text, hosted by the San Francisco Maritime National Park Association. Compass corrections and navigation (PDF).
  19. Fisheries and Oceans Canada — Small boat safetyChart scales, parallel rulers and dividers (PDF).
  20. National Park Service — William Clark: a master cartographerExpedition equipment, course estimates and mapping practices.
  21. National Park Service — The expedition’s artificial horizonA reflecting surface substituted for an obscured horizon on land.
  22. University of Nebraska–Lincoln — The scientific instruments of Lewis and ClarkSilvio A. Bedini, Great Plains Quarterly, 1984. Instruments, lunar observations and their practical limitations.
  23. NOAA — The Global Positioning SystemSignal timing and solving position together with receiver-clock error.
  24. Library of Congress — Lewis and Clark’s mapsField sketches incorporating Indigenous geographic information.
Photographs, diagrams & historical scope

The photographs show surviving historical instruments, photographed in modern museums. Their dates identify when the objects were made, not when the photographs were taken. Each photograph links to its source and reuse license; these resized WebP copies retain the stated CC BY-SA 4.0 license. The explanatory diagrams are original simplified drawings. Star and observer symbols are schematic, and the nautical chart is invented for teaching, not navigation.

The visual setting draws on the eighteenth-century chart room. The story spans earlier navigation, the longitude work of the 1700s, nineteenth-century practice and modern satellites. This is one thread through a much wider global history of navigation.

Return to the beginning ↑
CONTINUE THROUGH THE FOUNDRY

Endurance

Into the ice. Against the impossible. ↗

NYCHOLAS BURNSFAITH. CURIOSITY. CONVICTION.